Choosing Right Colormap for Heatmap
Improve the interpretation of a heatmap
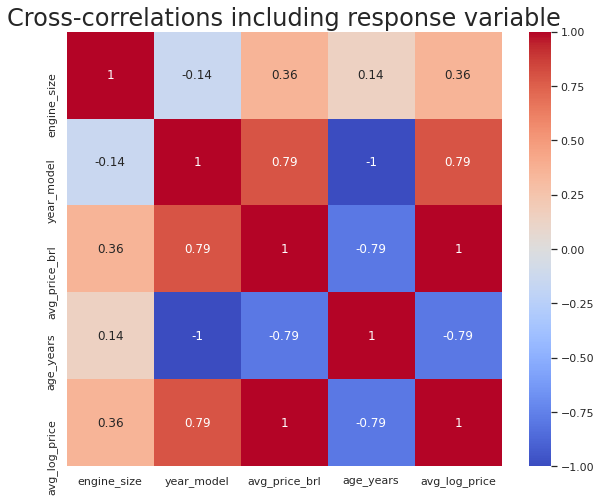
Heatmaps are used to visually represent correlation between various continuous features in a dataset. You can construct heatmaps and give them different colours for different values. This gives good visual appeal and makes it easier to understand.