The Validation Curve
Tells you where to get off
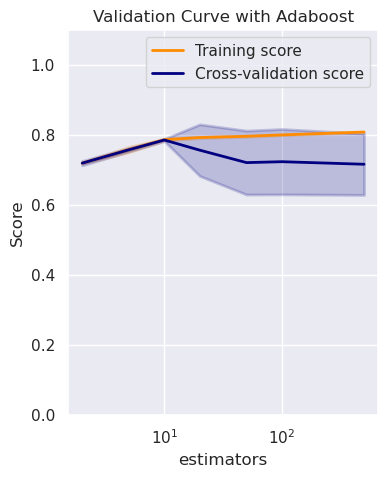
Sometimes, you need to know when to stop training your model; this curve helps you decide. Let us see the validation curve applied to an Adaboost classifier use case.

Tells you where to get off

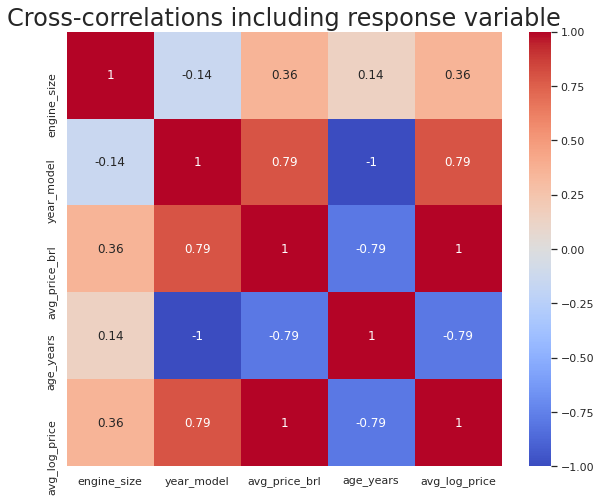
Improve the interpretation of a heatmap
Heatmaps are used to visually represent correlation between various continuous features in a dataset. You can construct heatmaps and give them different colours for different values. This gives good visual appeal and makes it easier to understand.
The convenience of horizontal histograms
Most NLP projects require us to look at word counts in documents. The traditional way is to draw histograms with vertical bars. But, are they convenient?